Say hello to
Order-Level Reconciliation For Multi-Outlet Food & Beverage.
The books don't close until every rupee does.
Tabl accounts for every order, deduction and payout across every platform. Your close stops waiting.
The leak is in
every order.
A few rupees an order. Thousands of orders a day. Across every outlet, on every platform.
- Payouts land as one net figure. The order-level detail sits somewhere else.
- POS sales, payouts and bank credits disagree every day.
- Your team matches by hand, one order at a time. Hours lost, errors missed.
- The close waits. And cash leaks, order by order, unnoticed.
Tabl accounts for all of it.
Every transaction in one place, tagged by order ID, outlet and platform. Every exception flagged with the amount at risk. Your team stops hunting and starts closing.
| Order ID | Outlet | Platform | Delta | Status |
|---|
From raw payouts
to financial close.
-
Ingest
Aggregators, gateways, POS, ERP, bank statements, email. Our connectors pull it all into one window. No portal logins, no downloads.
-
Match
Every order matched to its payout and its bank credit, with every commission, tax and deduction accounted for.
-
Investigate
Exceptions ranked by amount at risk. Open one, trace it to source, and resolve it.


See the whole picture.
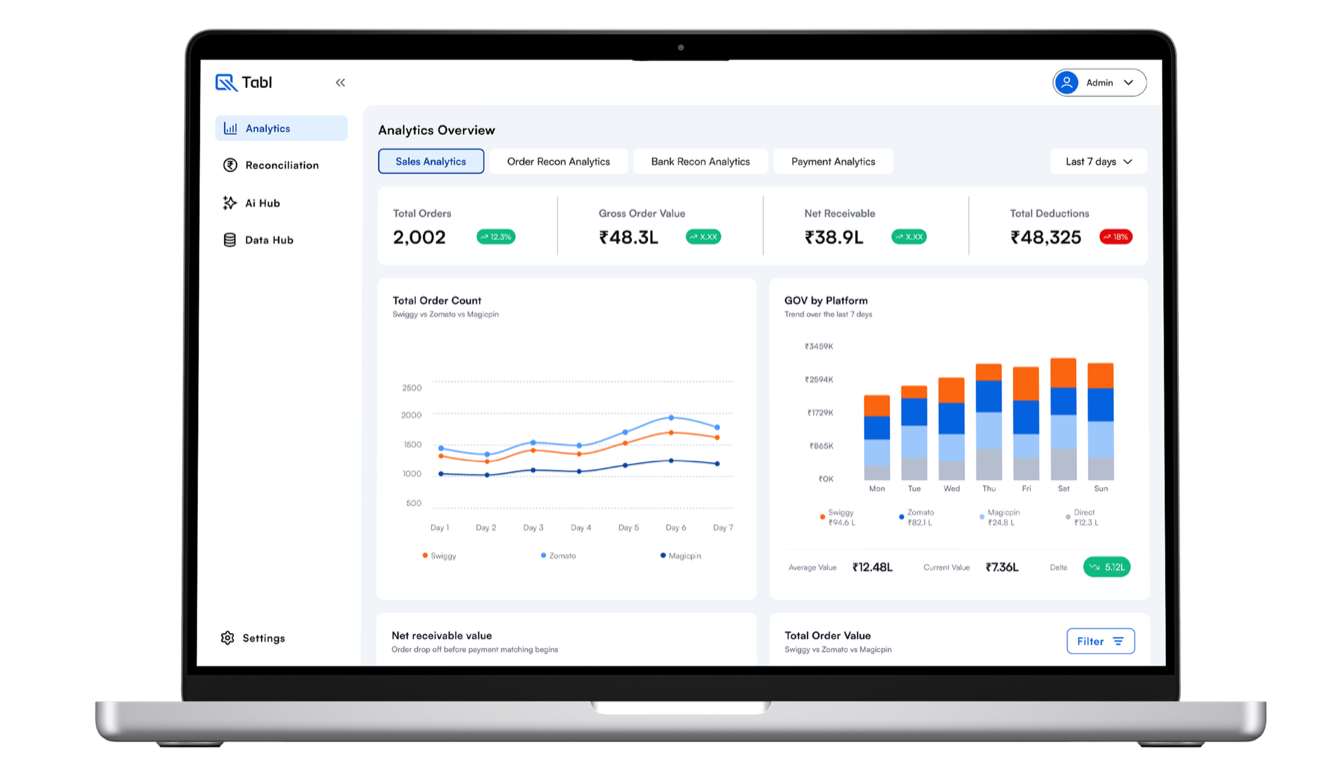
Dashboards across sales, payments and reconciliation show what changed and where.
Exception Value Breakdown
Order drop-off before payment matching begins
Value at Risk by Platform
Trend over the last 7 days
Stacked value at risk by platform for Monday through Sunday, rising towards the end of the week.
- App1 ₹94.6 L
- App2 ₹82.1 L
- App3 ₹24.8 L
- Direct ₹12.3 L
Ask it anything.
Type a question in plain language, and the Agentic AI Hub answers from your own data.
Show me the value at risk trend over the last 7 days
The trend view covers 6 recent data points. Use the line chart to identify spikes, then drill into platform leakage or triage.
And build a report.
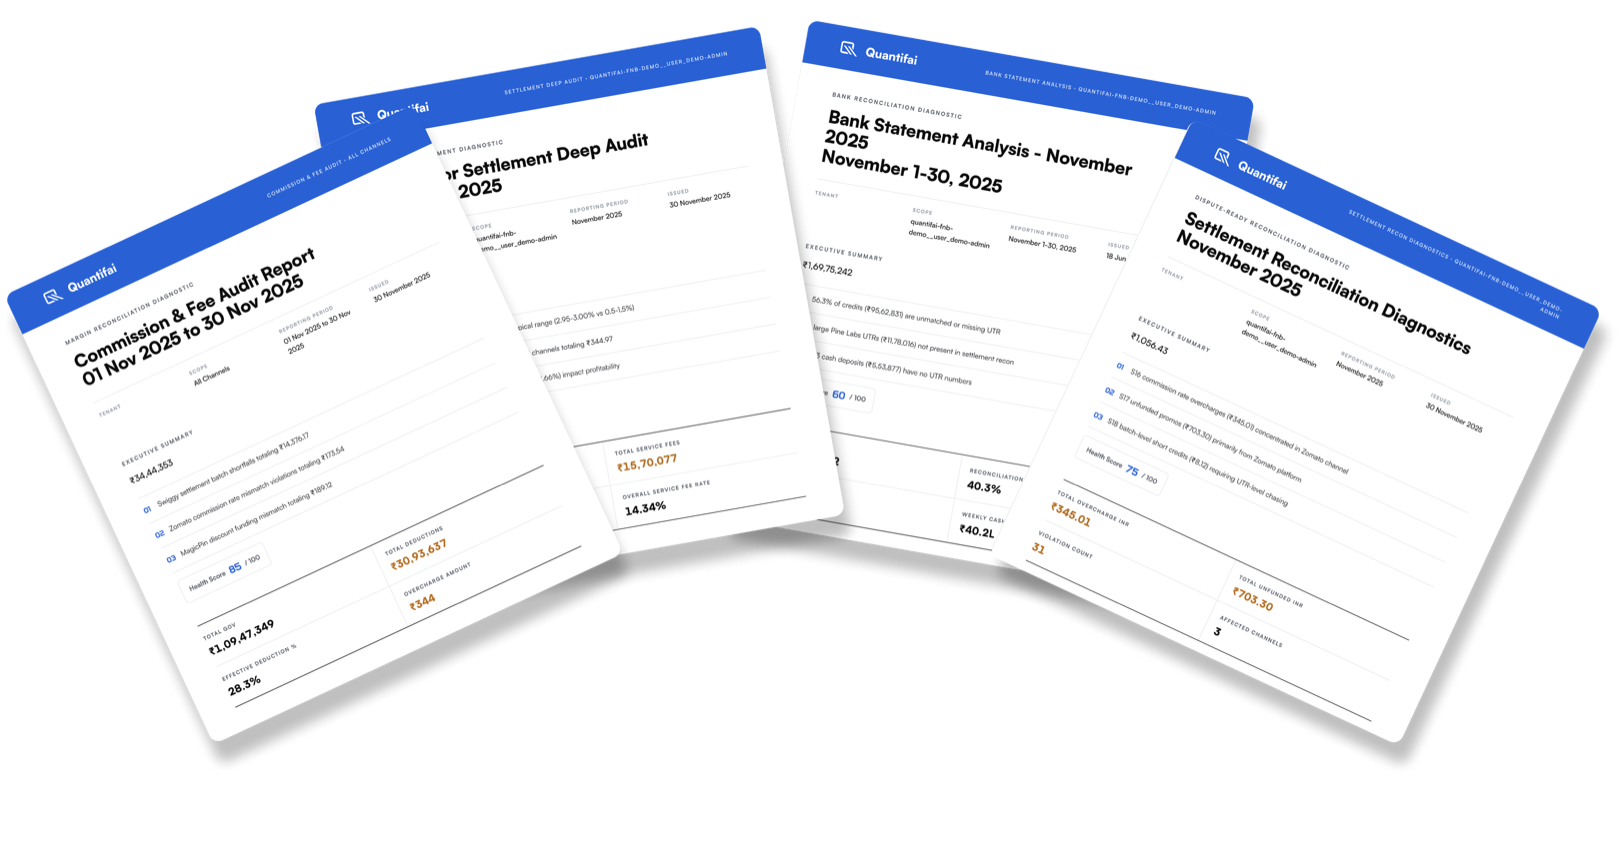
Settlement audits, commission checks, bank analysis, reconciliation diagnostics. Set the period and Tabl assembles the document, ready to download or send on.
Live in weeks. Not months.
No IT project. Tabl fits the systems and partner workflows you already run, at 20 outlets or 3,000.
- Connect
- Reconcile
- Go live!
It's that simple!